
Kasten K10 运维提高系列 04 在 Slack 中接收 Kasten K10 告警
前言
如今备份 Kubernetes 应用程序已经是企业 Kubernetes 运维过程的重要组成部分。当您在 Kasten k10 中运行备份、导入或恢复云原生应用时,由于 Kasten k10 提供了所见即所得的仪表盘,您马上就会发现,这次的备份任务是否成功执行。但是,当您将备份操作为日常CI/CD 或是 DevOps 策略的一部分运行时,透明化就显得尤为重要了。当系统并行运行多任务时,大多数应用都在后台运行。如果出现任何问题,则会有直到运维人员查看仪表盘时才会得知的后果。这时我们应该注意到,实际上企业的应用程序已经不再受到保护,而且失去了重要备份时间点!异常处理是Kubernetes 运维过程中无法逾越的问题。但这要及时解决问题,我们推荐使用 Slack 通知程序对用户指定的频道发出报警信息,经过测试这真上一种行之有效的方法,让我们开始吧。
本篇本文详细参考了 Kasten Solutions Architect Michael Courcy 的文章,在理解与文章结构上做了调整,以符合国人的阅读习惯。
How to Set Up Alerts in Kasten K10 to Immediately Catch Failed Backups
https://blog.kasten.io/posts/how-to-set-up-alerts-in-kasten-k10-to-immediately-catch-failed-backups
本文重要章节
Kasten K10 运维提高系列 04 在 Slack 中接收 Kasten K10 告警
1. 前言 - 为什么要结合 Slack 频道实现主动报警
2. Slack 与 Slack 频道的介绍
3. 备份失败的原因
3. 部署过程
3.1 Prometheus 架构与配置
3.2 在 Slack 中启用 WebHooks
3.3. 配置 Prometheus 与 Alert Manager
5. 进行告警接收测试
5.1 制造错误的条件
5.2 检查 Prometheus Alert Manager
5.3 检查 Slack 中的报警信息
6. 结论
7. 参考资料
1. 前言 - 为什么要结合 Slack 频道实现主动报警
如今备份 Kubernetes 应用程序已经是企业 Kubernetes 运维过程的重要组成部分。当您在 Kasten k10 中运行备份、导入或恢复云原生应用时,由于 Kasten k10 提供了所见即所得的仪表盘,您马上就会发现,这次的备份任务是否成功执行。但是,当您将备份操作为日常CI/CD 或是 DevOps 策略的一部分运行时,透明化就显得尤为重要了。当系统并行运行多任务时,大多数应用都在后台运行。如果出现任何问题,则会有直到运维人员查看仪表盘时才会得知的后果。这时我们应该注意到,实际上企业的应用程序已经不再受到保护,而且失去了重要备份时间点!异常处理是Kubernetes 运维过程中无法逾越的问题。但这要及时解决问题,我们推荐使用 Slack 通知程序对用户指定的频道发出报警信息,经过测试这真上一种行之有效的方法,让我们开始吧。
2. Slack 与 Slack 频道的介绍
Slack 是一个协作中心,可以汇集适当的人员、信息和工具,由此高质量地完成工作。从《财富》100 强公司到垄断市场,世界各地数以百万计的人都在使用 Slack,以协调团队工作,实现系统整合,借此推动业务的长效发展。
Slack 频道 Slack 将对话整理到名为频道的专用空间中。频道让工作变得有序且清楚,你可以为任何项目、主题或团队创建频道。将所需的人员和信息集中到同一个地方,团队可以分享想法、做出决策,并推进工作。
关于 Slack
https://slack.com/intl/zh-cn/about
Slack频道是什么?
https://slack.com/intl/zh-cn/help/articles/360017938993-%E9%A2%91%E9%81%93%E6%98%AF%E4%BB%80%E4%B9%88%EF%BC%9F
3. 备份失败的原因
企业的备份系统是与时俱进的,备份策略的创建与执行将是一个不断迭代的过程。对于一套设计良备份策略,出现异常的可能性会比较低,但这并不意味着不会出现异常,有些异常甚至会引起严重的后果,所以如何及时的发现备份策略运行的异常并处理它便显得十分重要了。通常,依靠运维人员反馈、与查看日志来发现问题,即不可靠又不及时。备份失败的原因有很多。这里只是一些常见的:
- 凭证的更改
- 存储故障(容量已满或超出配额)
- 有些Pod 停留在错误状态
- 备份存储库已移动或删除
- 网络故障
- 错误配置更改
- 超时
由于备份可能因多种不同原因而失败,我们建议您在投入生产时实施告警系统。通过一些配置更改,您可以实现直接进入事件系统的警报。在这篇文章中,我将向您介绍如何设置警报以直接发送到 Slack 频道。可以采取相同的步骤将 Kasten 的告警,接入电子邮件或其他系统(例如 ServiceNow、Pager Duty 或 JIRA)以发送警报。
3. 部署过程
3.1 Prometheus 架构与配置
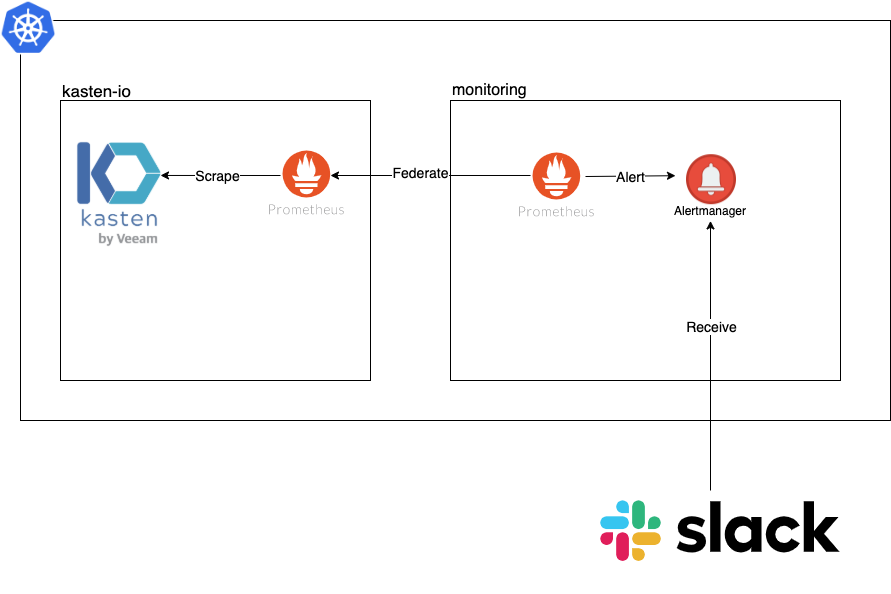
事实上, Kasten K10 已经通过与 Prometheus 集成,集中监控其所有活动。特别是,它公开了一个 Prometheus 端点,我们可以直接去 http://Kasten-expose-IP:Port/k10/prometheus/graph 进行访问。但我们要强调的是,请不要修改 Kasten 中的 Prometheus 配置,因为这个实例是由 Kasten (包括安装包管理程序 Helm) 统一进行管理的,最好不要手动修改。因此,我们建立使用 Kasten Prometheus 实例联合URL的方式,在另一个 Namespace 中启动一个 Prometheus 实例,架构图如下:
3.2 在 Slack 中启用 WebHooks
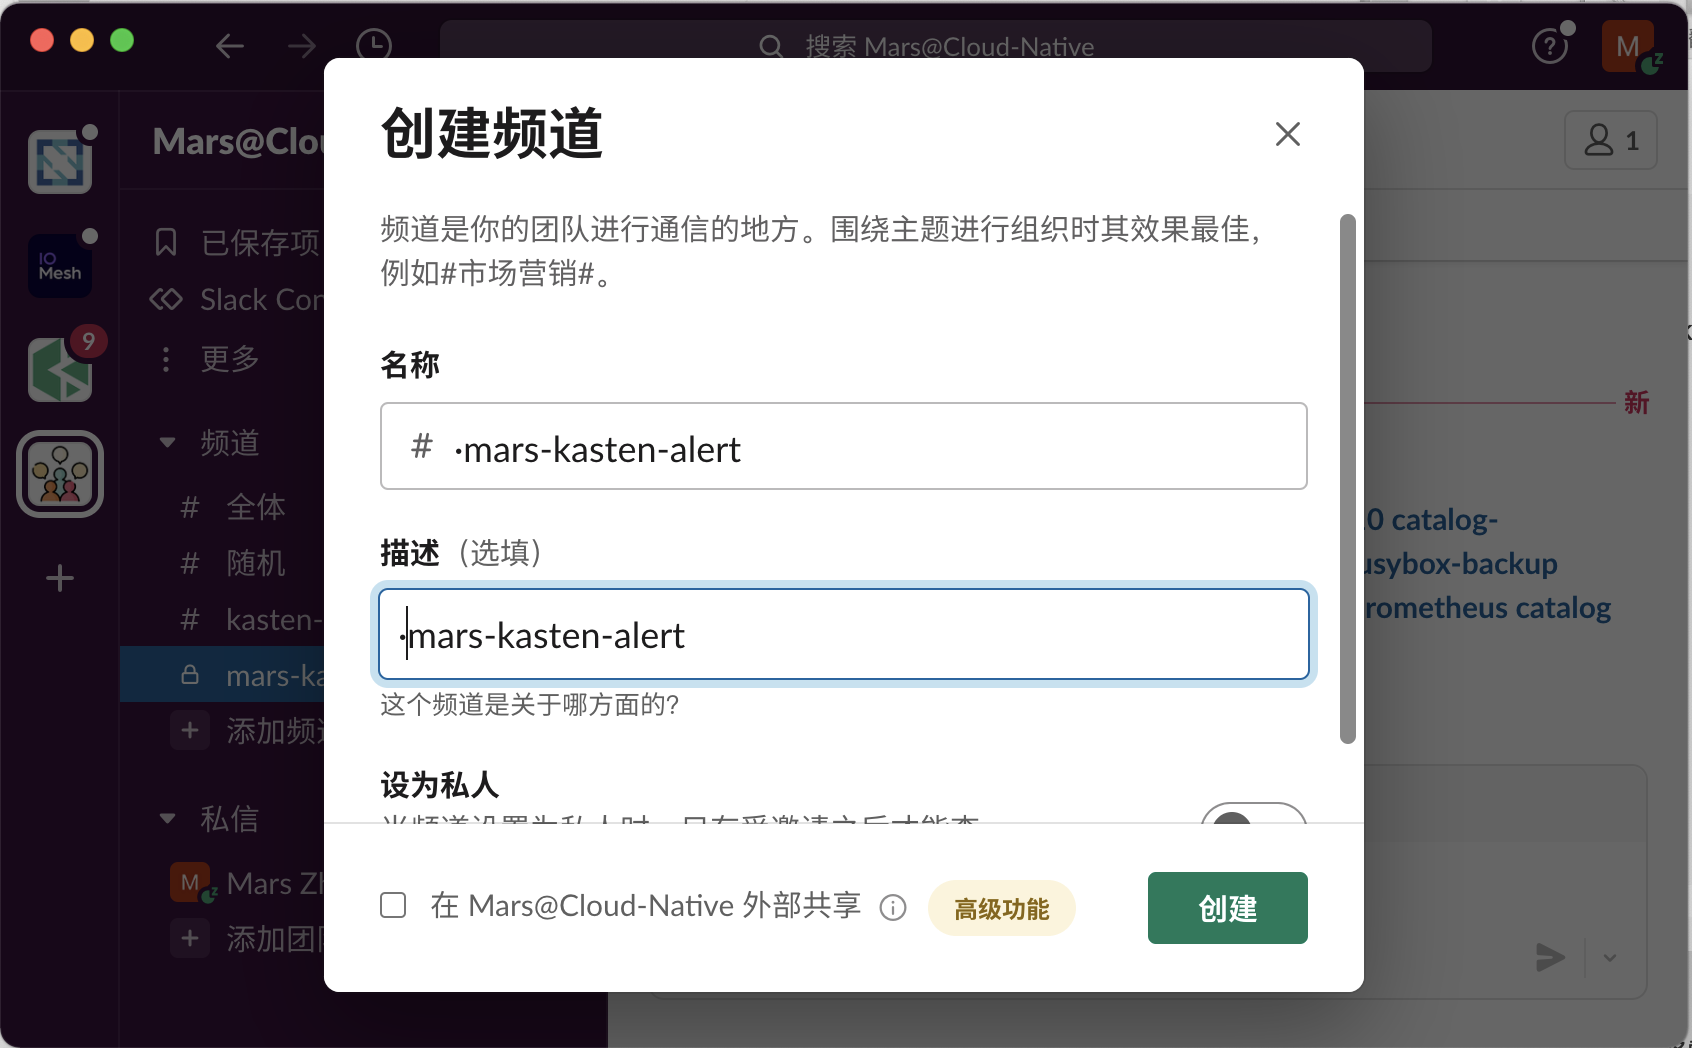
Slack 中的 WebHooks 允许您将消息发送到 Slack 通道,这就是您将配置警报管理器以及要执行的操作。首先,我们创建一个 Slack 频道,在这里我创建的频道名为 mars-kasten-alert
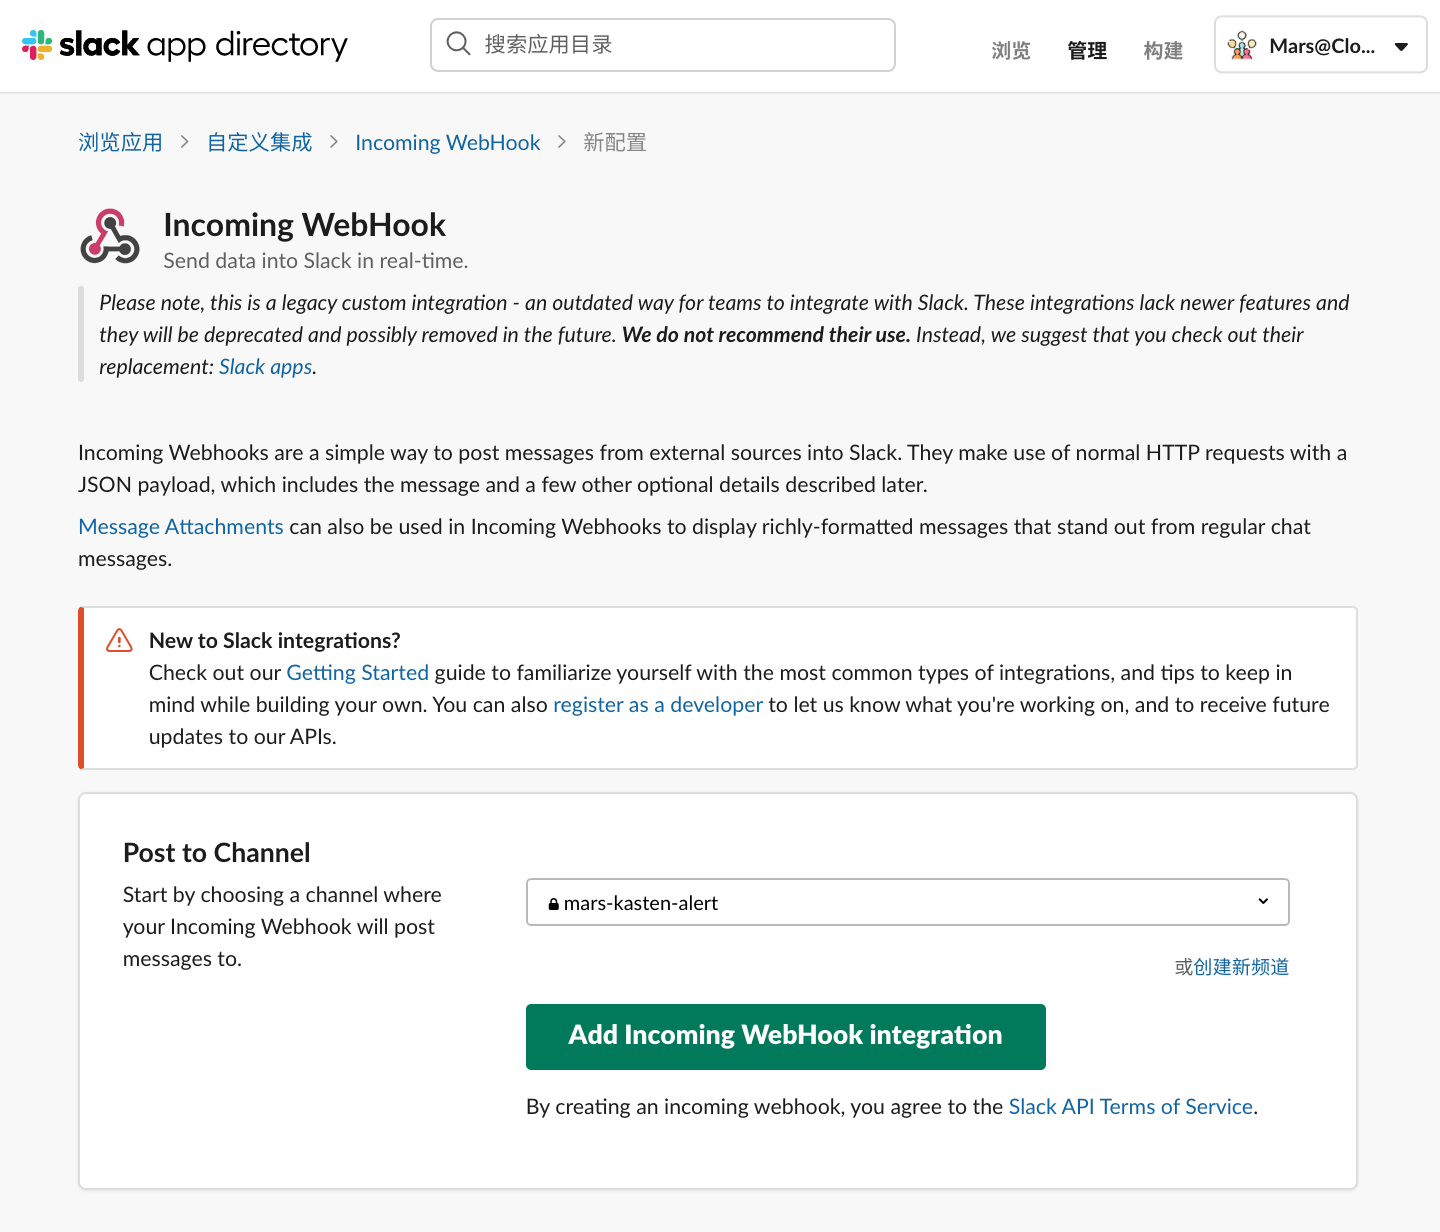
然后从"应用"菜单中添加 Incoming WebHooks 应用程序。
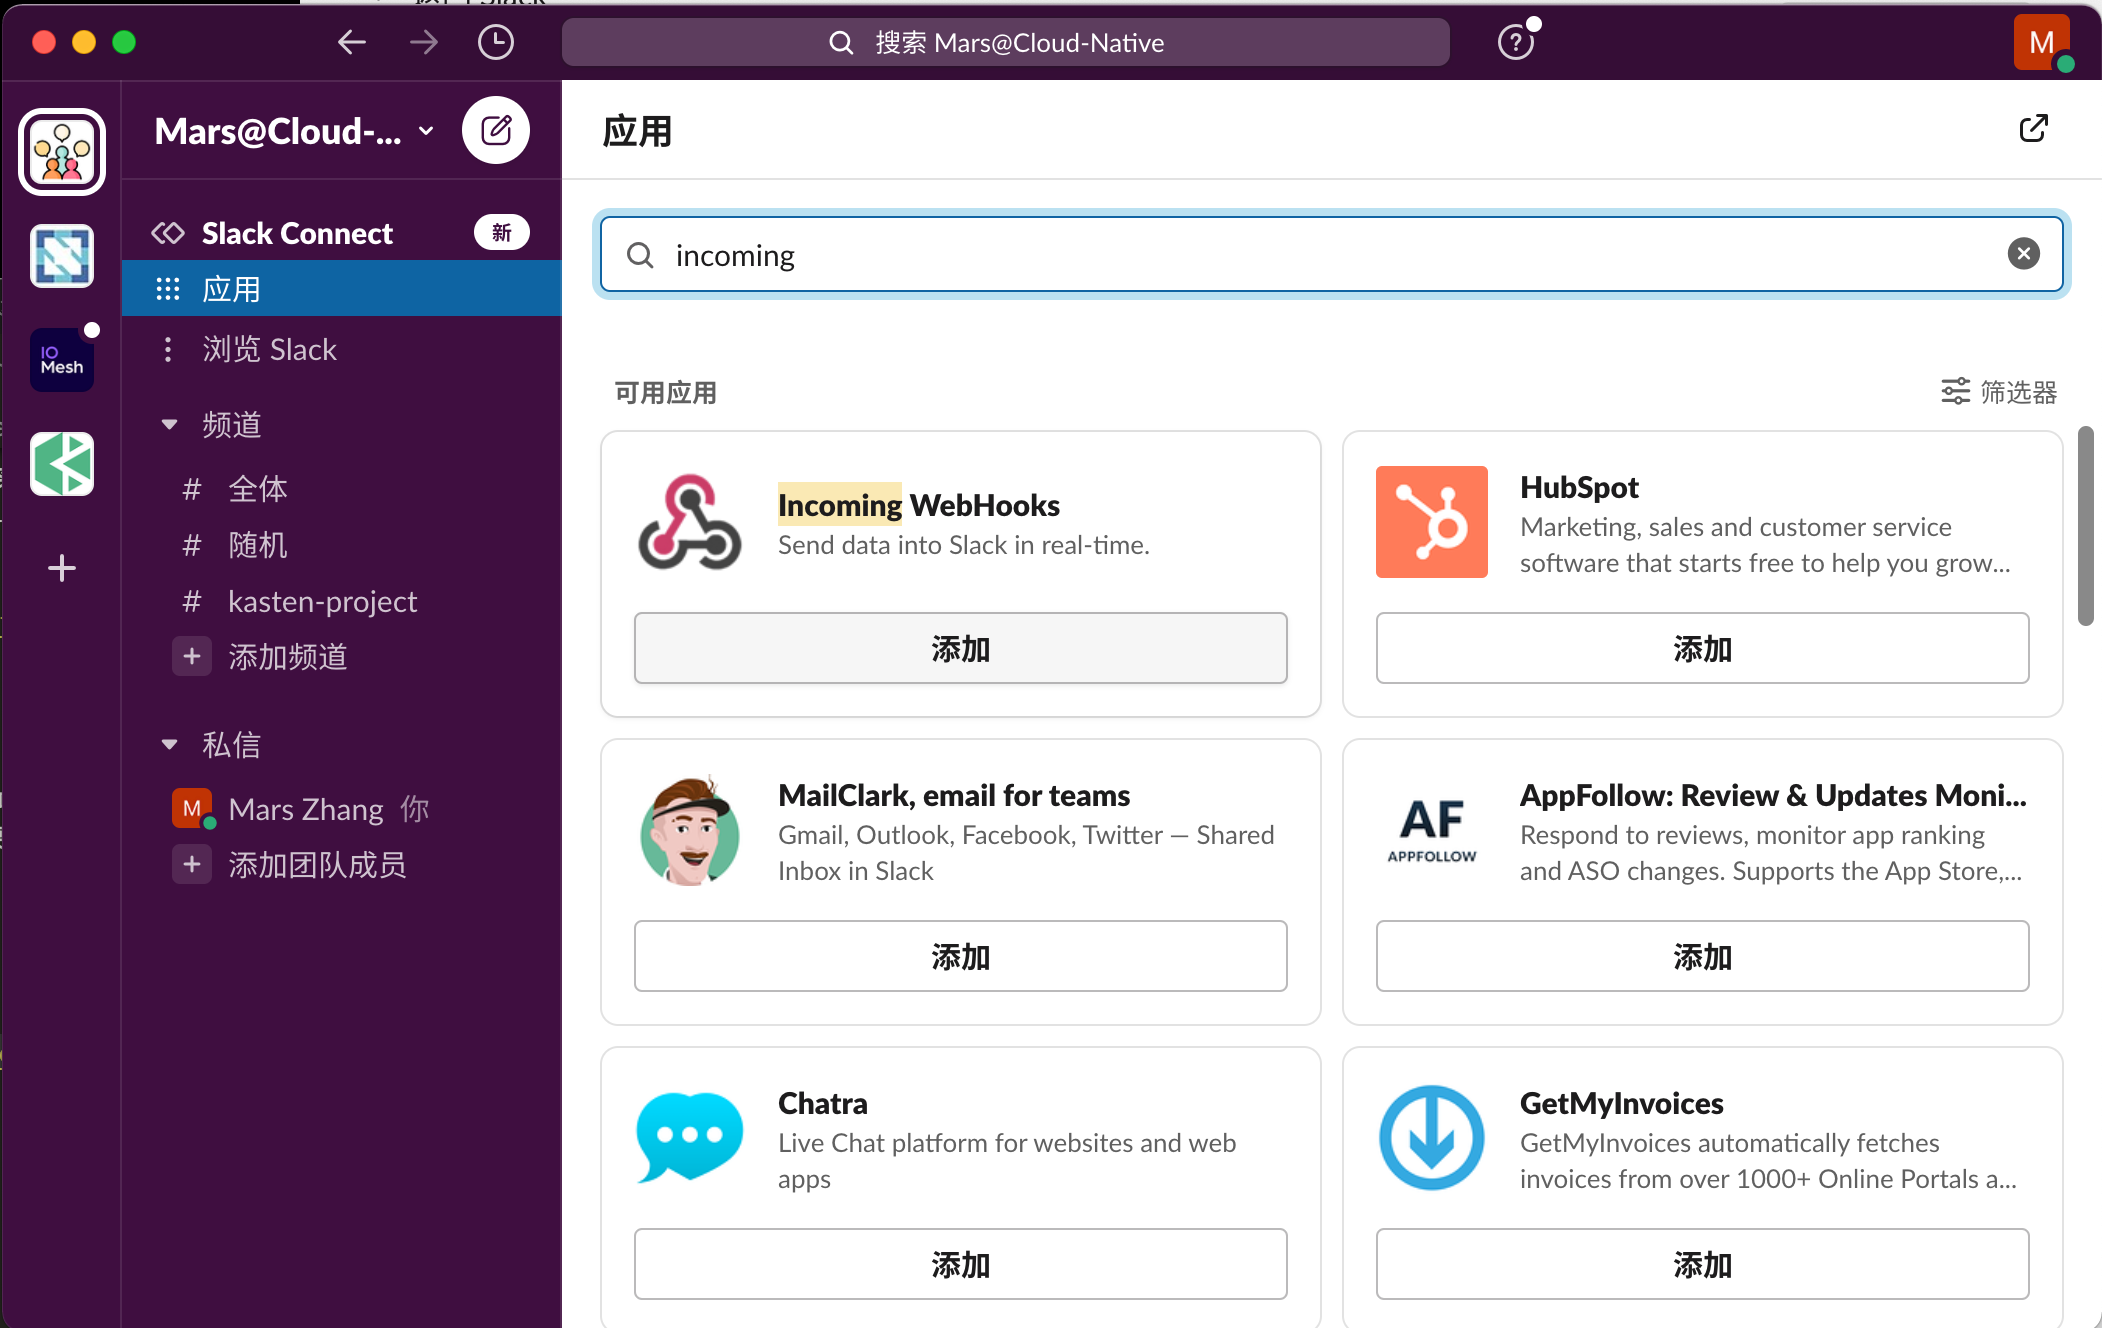
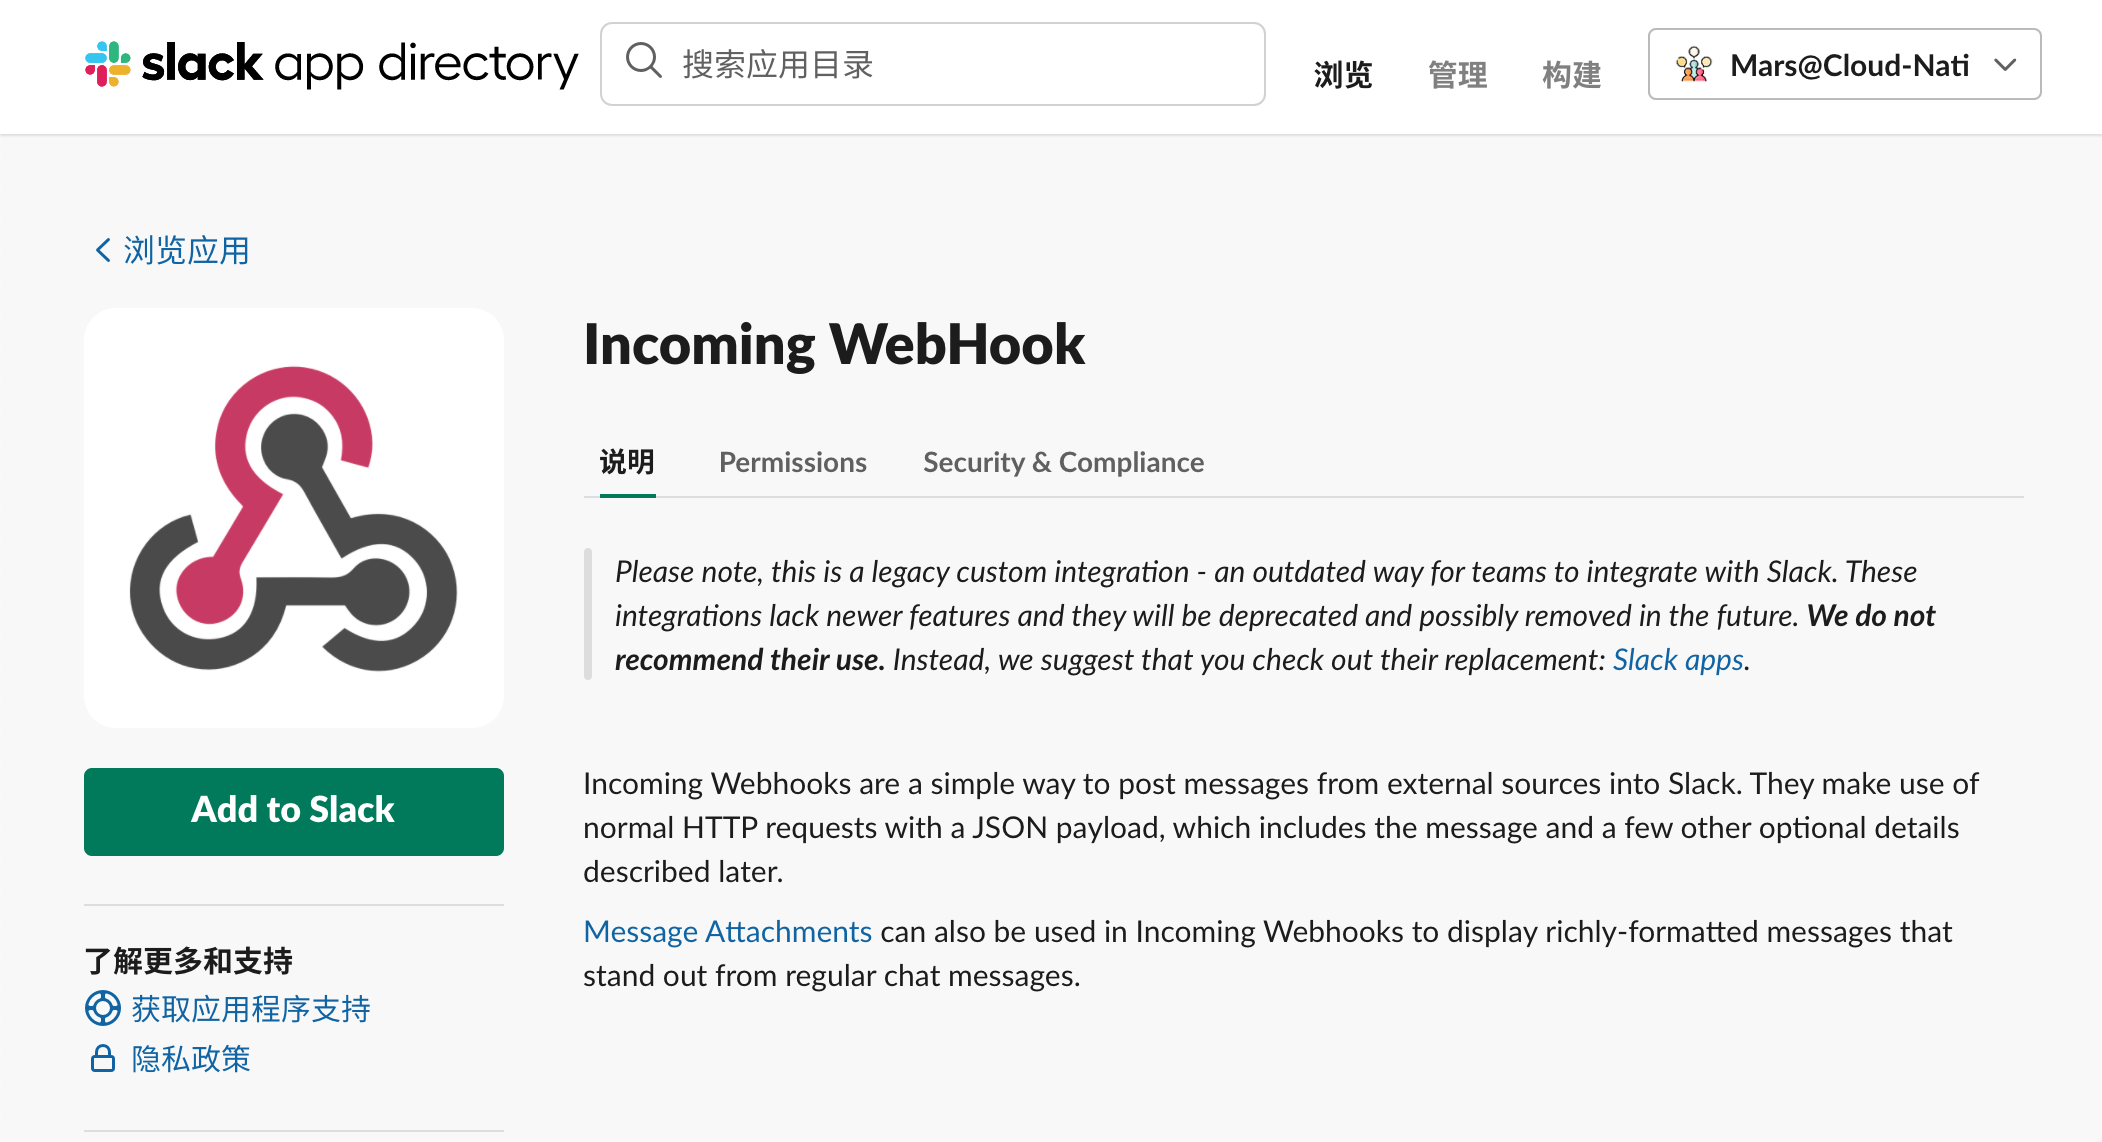
在 浏览应用 中点击 Add to Slack
在 Post to Channel 选择刚刚我们建立的频道 mars-kasten-alert 点击 Add Incoming WebHook integration
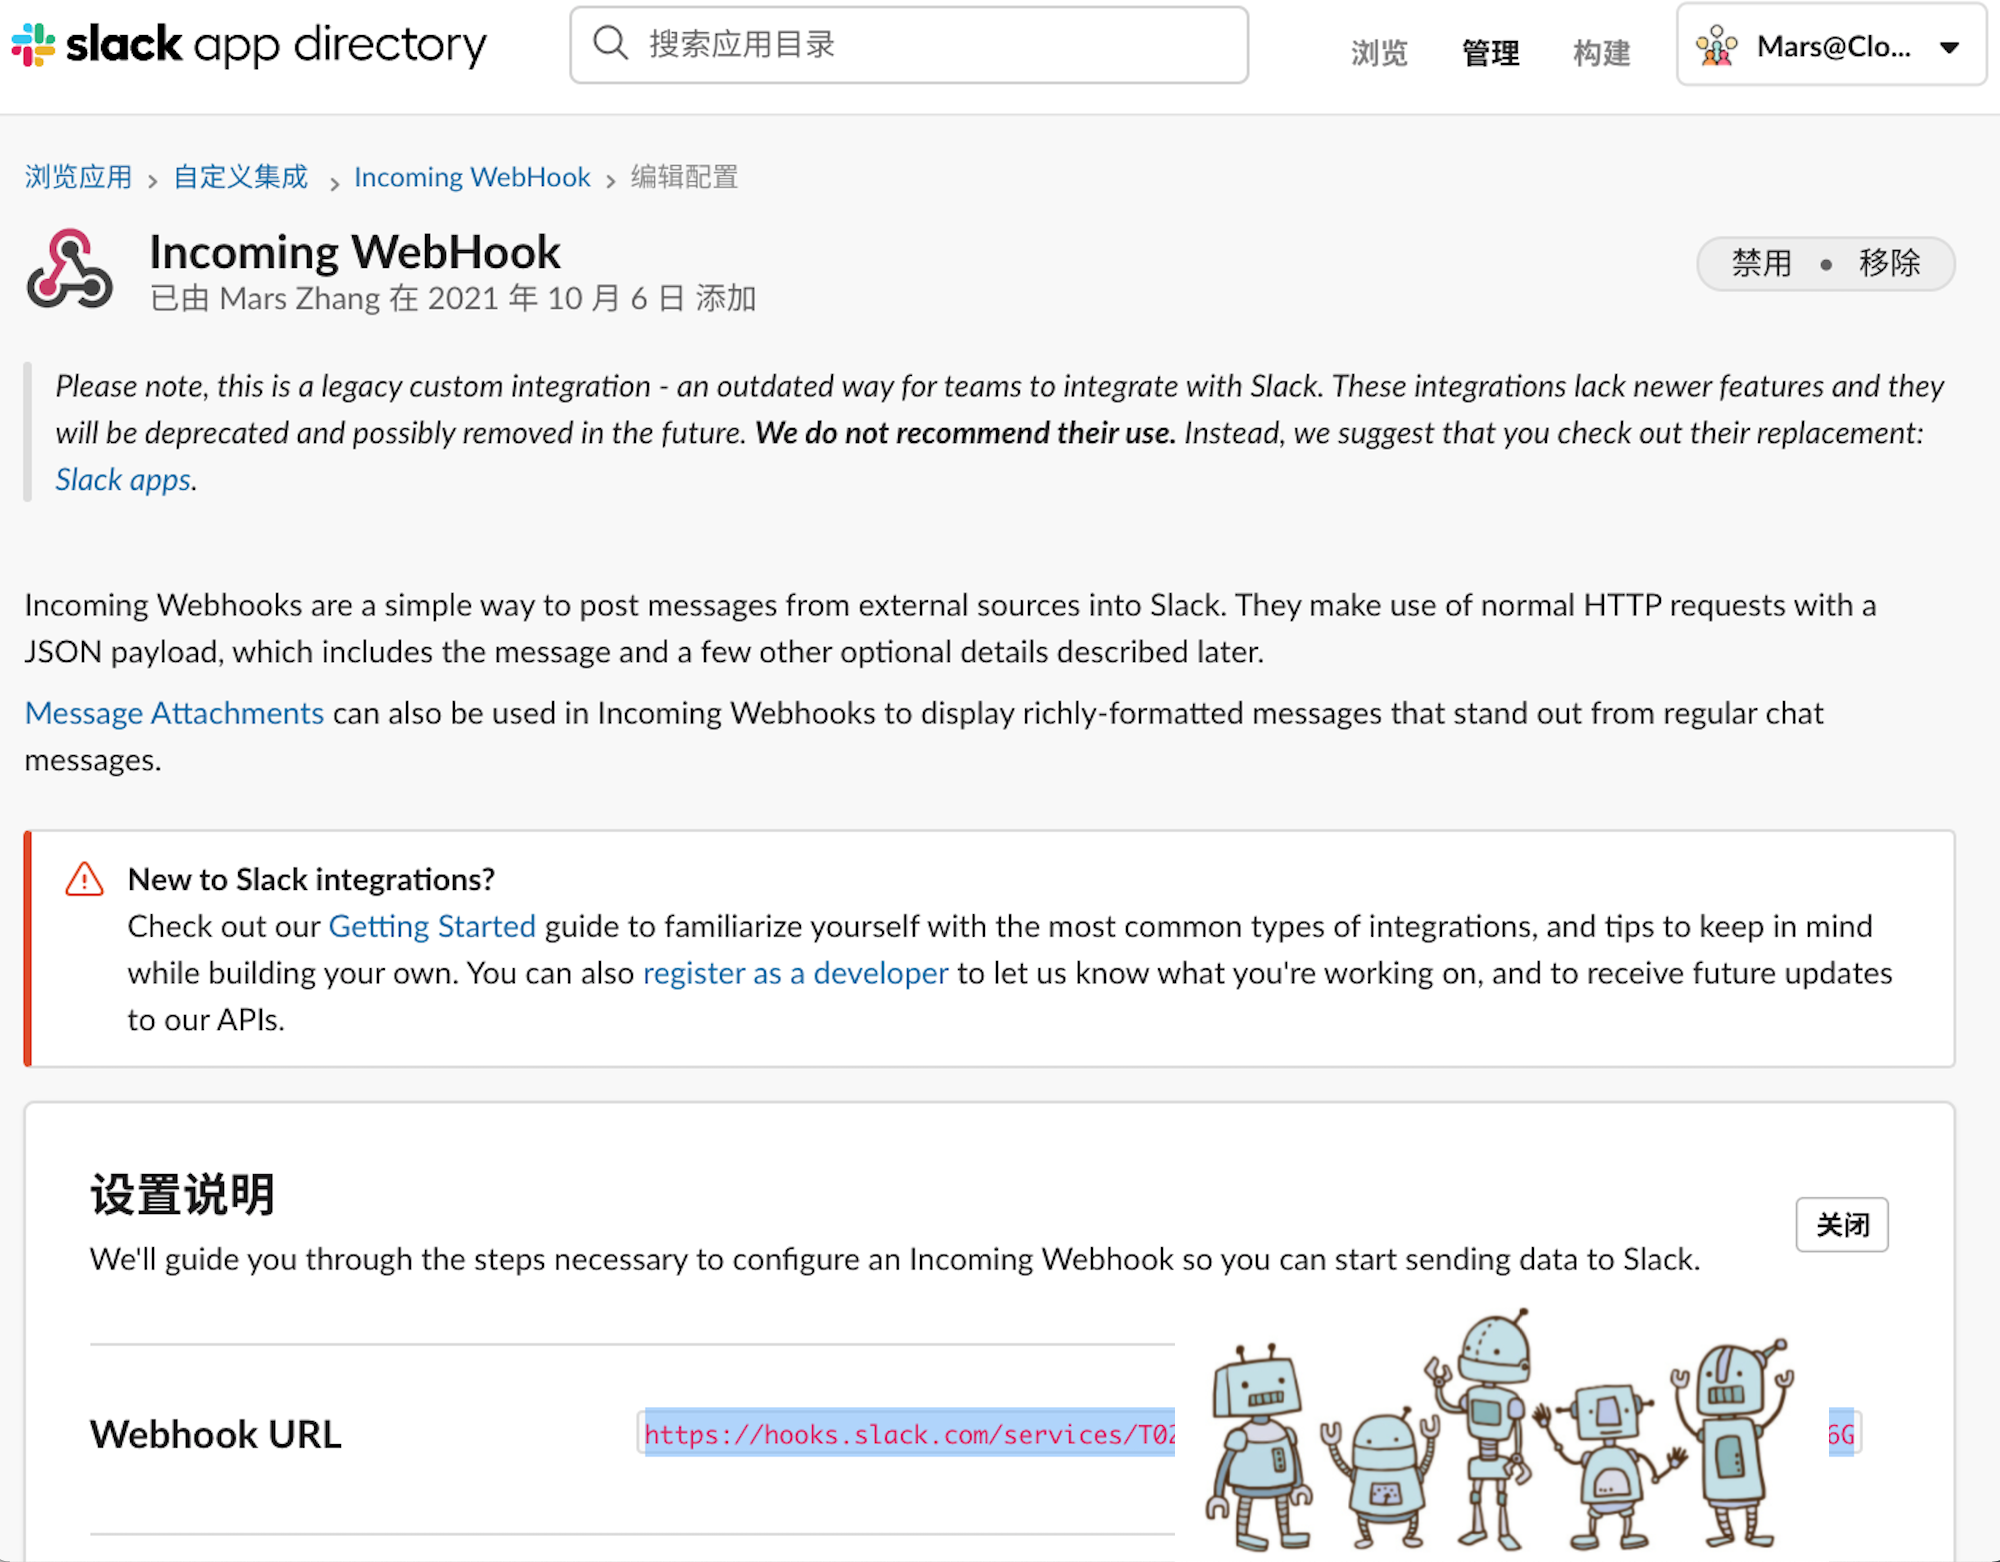
把 WebHook URL 复制下来,用于我们配置新的 Prometheus 实例
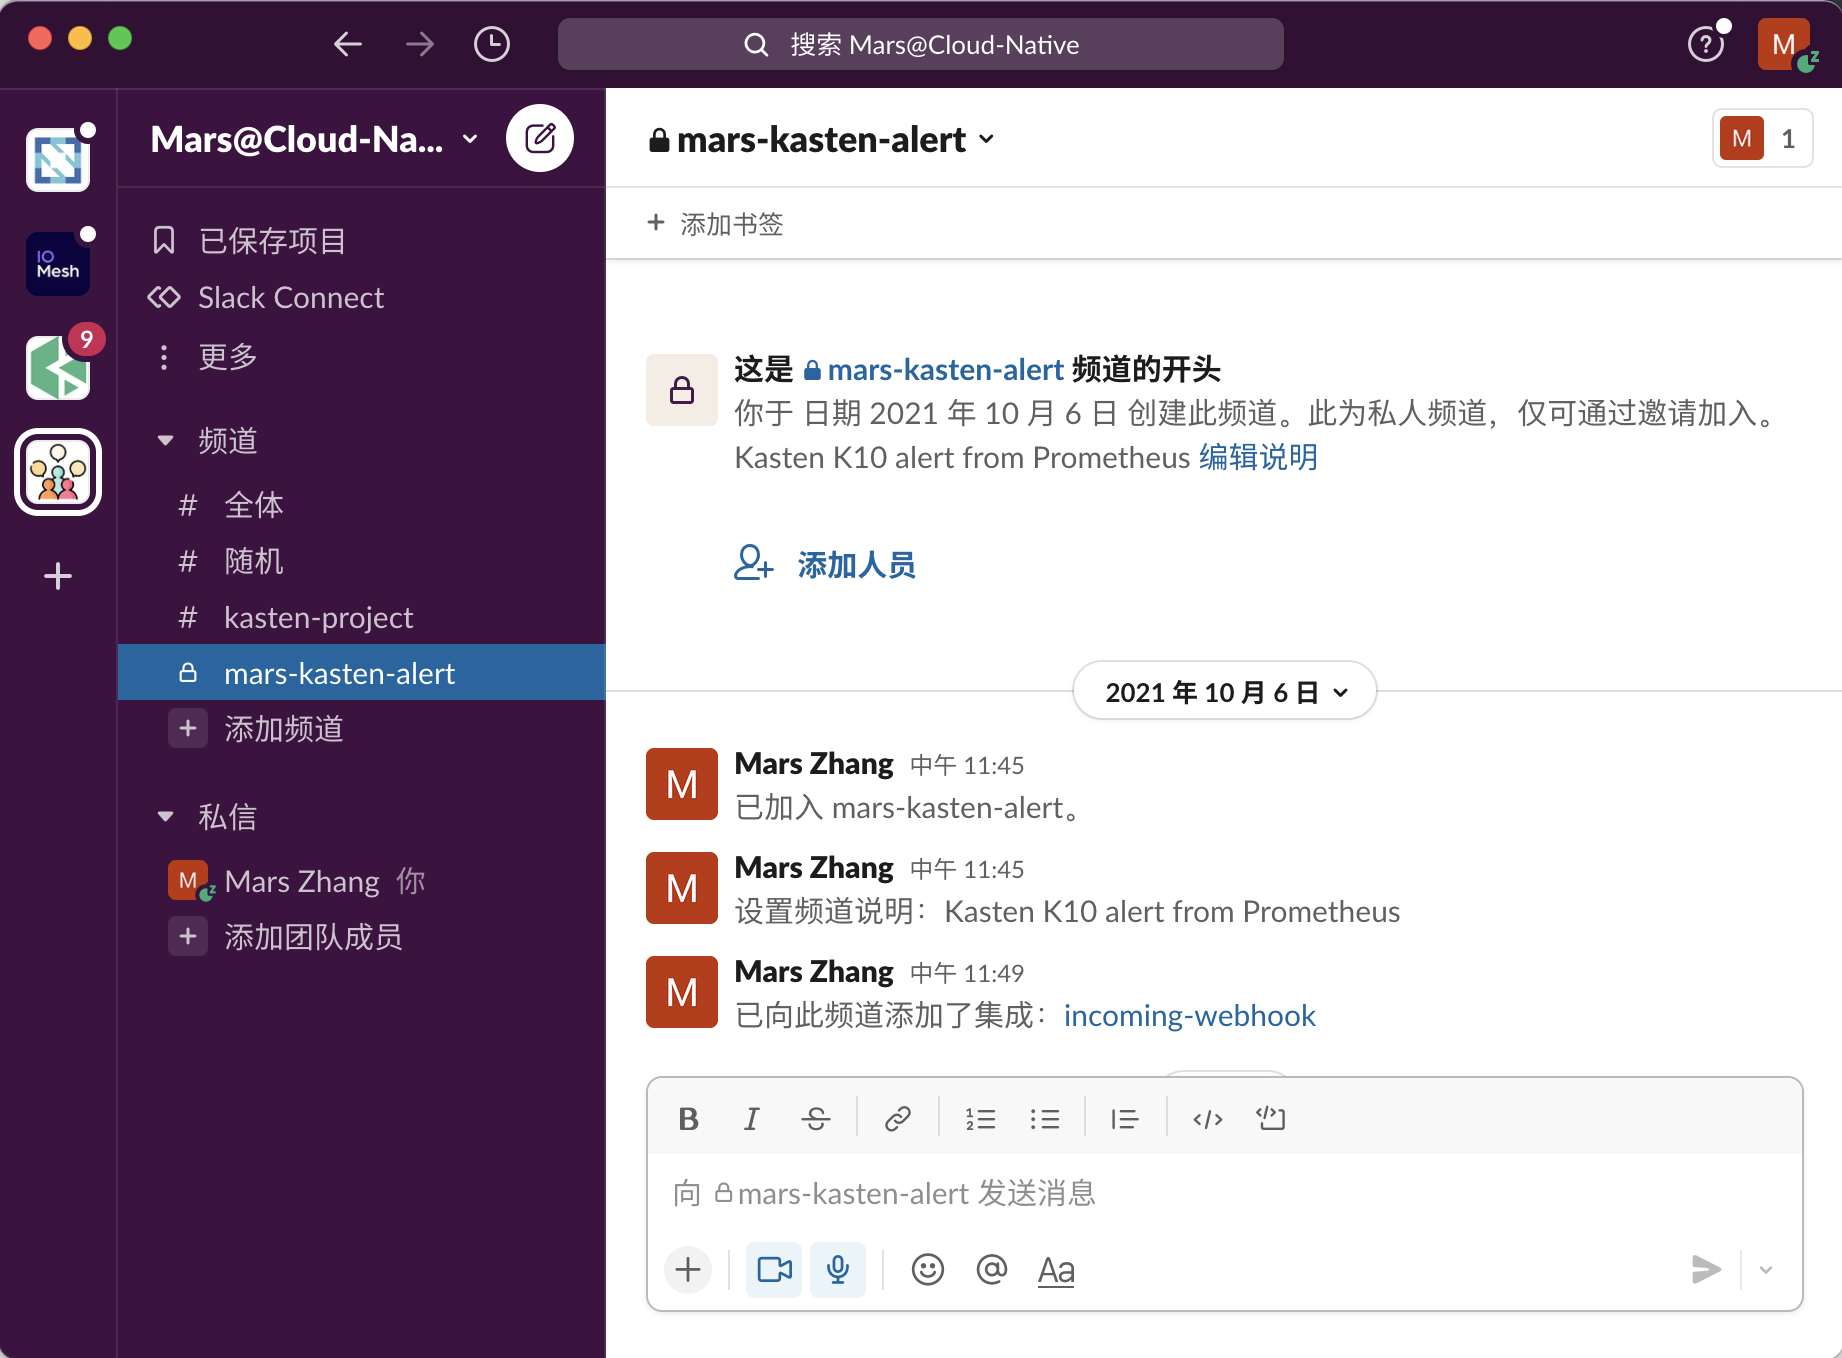
配置完成后,您将在 Slack 中发现 已向此频道添加了集成:Incoming WebHook
测试 Incoming WebHook 能否成功接收数据, 将在 Slack 中接收到如下信息。
$ curl -X POST --data-urlencode "payload={\"channel\": \"#mars-kasten-alert\", \"username\": \"webhookbot\", \"text\": \"This is posted to #mars-kasten-alert and comes from a b
ot named webhookbot.\", \"icon_emoji\": \":ghost:\"}" https://hooks.slack.com/services/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
ok
将在 Slack 中接收到如下信息

3.3. 配置 Prometheus 与 Alert Manager
1.建立 monitoring Namespace
$ kubectl create ns monitoring
namespace/monitoring created
2. 添加 Prometheus community Helm Chart
$ helm repo add prometheus-community https://prometheus-community.github.io/helm-charts
"prometheus-community" has been added to your repositories

$ helm repo list
NAME                    URL
openebs                 https://openebs.github.io/charts
bitnami                 https://charts.bitnami.com/bitnami
kasten                  https://charts.kasten.io
prometheus-community    https://prometheus-community.github.io/helm-charts
3. 配置 Prometheus 实例
创建 kasten_prometheus_values.yaml,将
- 配置一个 Prometheus Federation 实例, 以获取 K10 Prometheus Server 的指标项
- 为 Alert Manager 配置 Slack Notification receiver,以接收 Prometheus Server 的指标项
- 禁用 Prometheus 常用指标项
cat <<EOF > kasten_prometheus_values.yaml
defaultRules:
  create: false
alertmanager:
  config:
    global:
      resolve_timeout: 5m
    route:
      # If an alert has successfully been sent, wait 'repeat_interval' to
      # resend them.
      repeat_interval: 30m
      # A default receiver
      receiver: "slack-notification"
      routes:
      - receiver: "slack-notification"
        match:
          severity: kasten
    receivers:
      - name: "slack-notification"
        slack_configs:
#configure incoming webhooks in slack(https://slack.com/intl/en-in/help/articles/115005265063-Incoming-webhooks-for-Slack)
          - api_url: '<https://hooks.slack.com/services/...>'
            channel: '#mars-kasten-alert' #channel which the alert needs to be sent to
            text: "<!channel> \n\n"
prometheus:
  prometheusSpec:
    additionalScrapeConfigs:
# federation configuration for consuming metrics from K10 prometheus-server
      - job_name: k10
        scrape_interval: 15s
        honor_labels: true
        scheme: http
        metrics_path: '/k10/prometheus/federate'
        params:
          'match[]':
            - '{__name__=~"jobs.*"}'
            - '{__name__=~"catalog.*"}'
        static_configs:
          - targets:
            - 'prometheus-server.kasten-io.svc.cluster.local'
            labels:
              app: "k10"
#below values are to disable the components which are not required. It can be changed based on the
requirement.
grafana:
  enabled: false
kubeApiServer:
  enabled: false
kubelet:
  enabled: false
kubeStateMetrics:
  enabled: false
kubeControllerManager:
  enabled: false
kubeEtcd:
  enabled: false
kubeProxy:
  enabled: false
coreDns:
  enabled: false
kubeScheduler:
  enabled: false
EOF
4. 部署 Prometheus 实例
$ helm install prometheus prometheus-community/kube-prometheus-stack -n monitoring -f kasten_prometheus_values.yaml

NAME: prometheus
LAST DEPLOYED: Mon Oct 18 05:17:29 2021
NAMESPACE: monitoring
STATUS: deployed
REVISION: 1
TEST SUITE: None
NOTES:
kube-prometheus-stack has been installed. Check its status by running:
  kubectl --namespace monitoring get pods -l "release=prometheus"

Visit https://github.com/prometheus-operator/kube-prometheus for instructions on how to create & configure Alertmanager and Prometheus instances using the Operator.

~ 36s
$ kubectl --namespace monitoring get pods -l "release=prometheus"
NAME                                                  READY   STATUS    RESTARTS   AGE
prometheus-kube-prometheus-operator-8554997fc-kgbzd   1/1     Running   0          76s
prometheus-prometheus-node-exporter-njxw9             1/1     Running   0          76s

~
$ kubectl get po -n monitoring
NAME                                                     READY   STATUS    RESTARTS   AGE
alertmanager-prometheus-kube-prometheus-alertmanager-0   2/2     Running   0          92s
prometheus-kube-prometheus-operator-8554997fc-kgbzd      1/1     Running   0          111s
prometheus-prometheus-kube-prometheus-prometheus-0       2/2     Running   0          92s
prometheus-prometheus-node-exporter-njxw9                1/1     Running   0          111s
5. 创建 Prometheus 规则
创建一个 Prometheus Rule 来配置警报:
$ cat << EOF | kubectl -n monitoring create -f -
apiVersion: monitoring.coreos.com/v1
kind: PrometheusRule
metadata:
  labels:
    app: kube-prometheus-stack
    release: prometheus
  name: prometheus-kube-prometheus-kasten.rules
spec:
  groups:
  - name: kasten_alert
    rules:
    - alert: KastenJobsFailing
      expr: |-
        increase(catalog_actions_count{status="failed"}[10m]) > 0
      for: 1m
      labels:
        severity: kasten
      annotations:
        summary: "More than 1 failed K10 jobs for policy  for the last 10 min"
        description: " policy run for the application  failed in last 10 mins"
EOF
prometheusrule.monitoring.coreos.com/prometheus-kube-prometheus-kasten.rules created
5. 进行告警接收测试
简单三步,以确保警报正常工作.
5.1 制造错误的条件
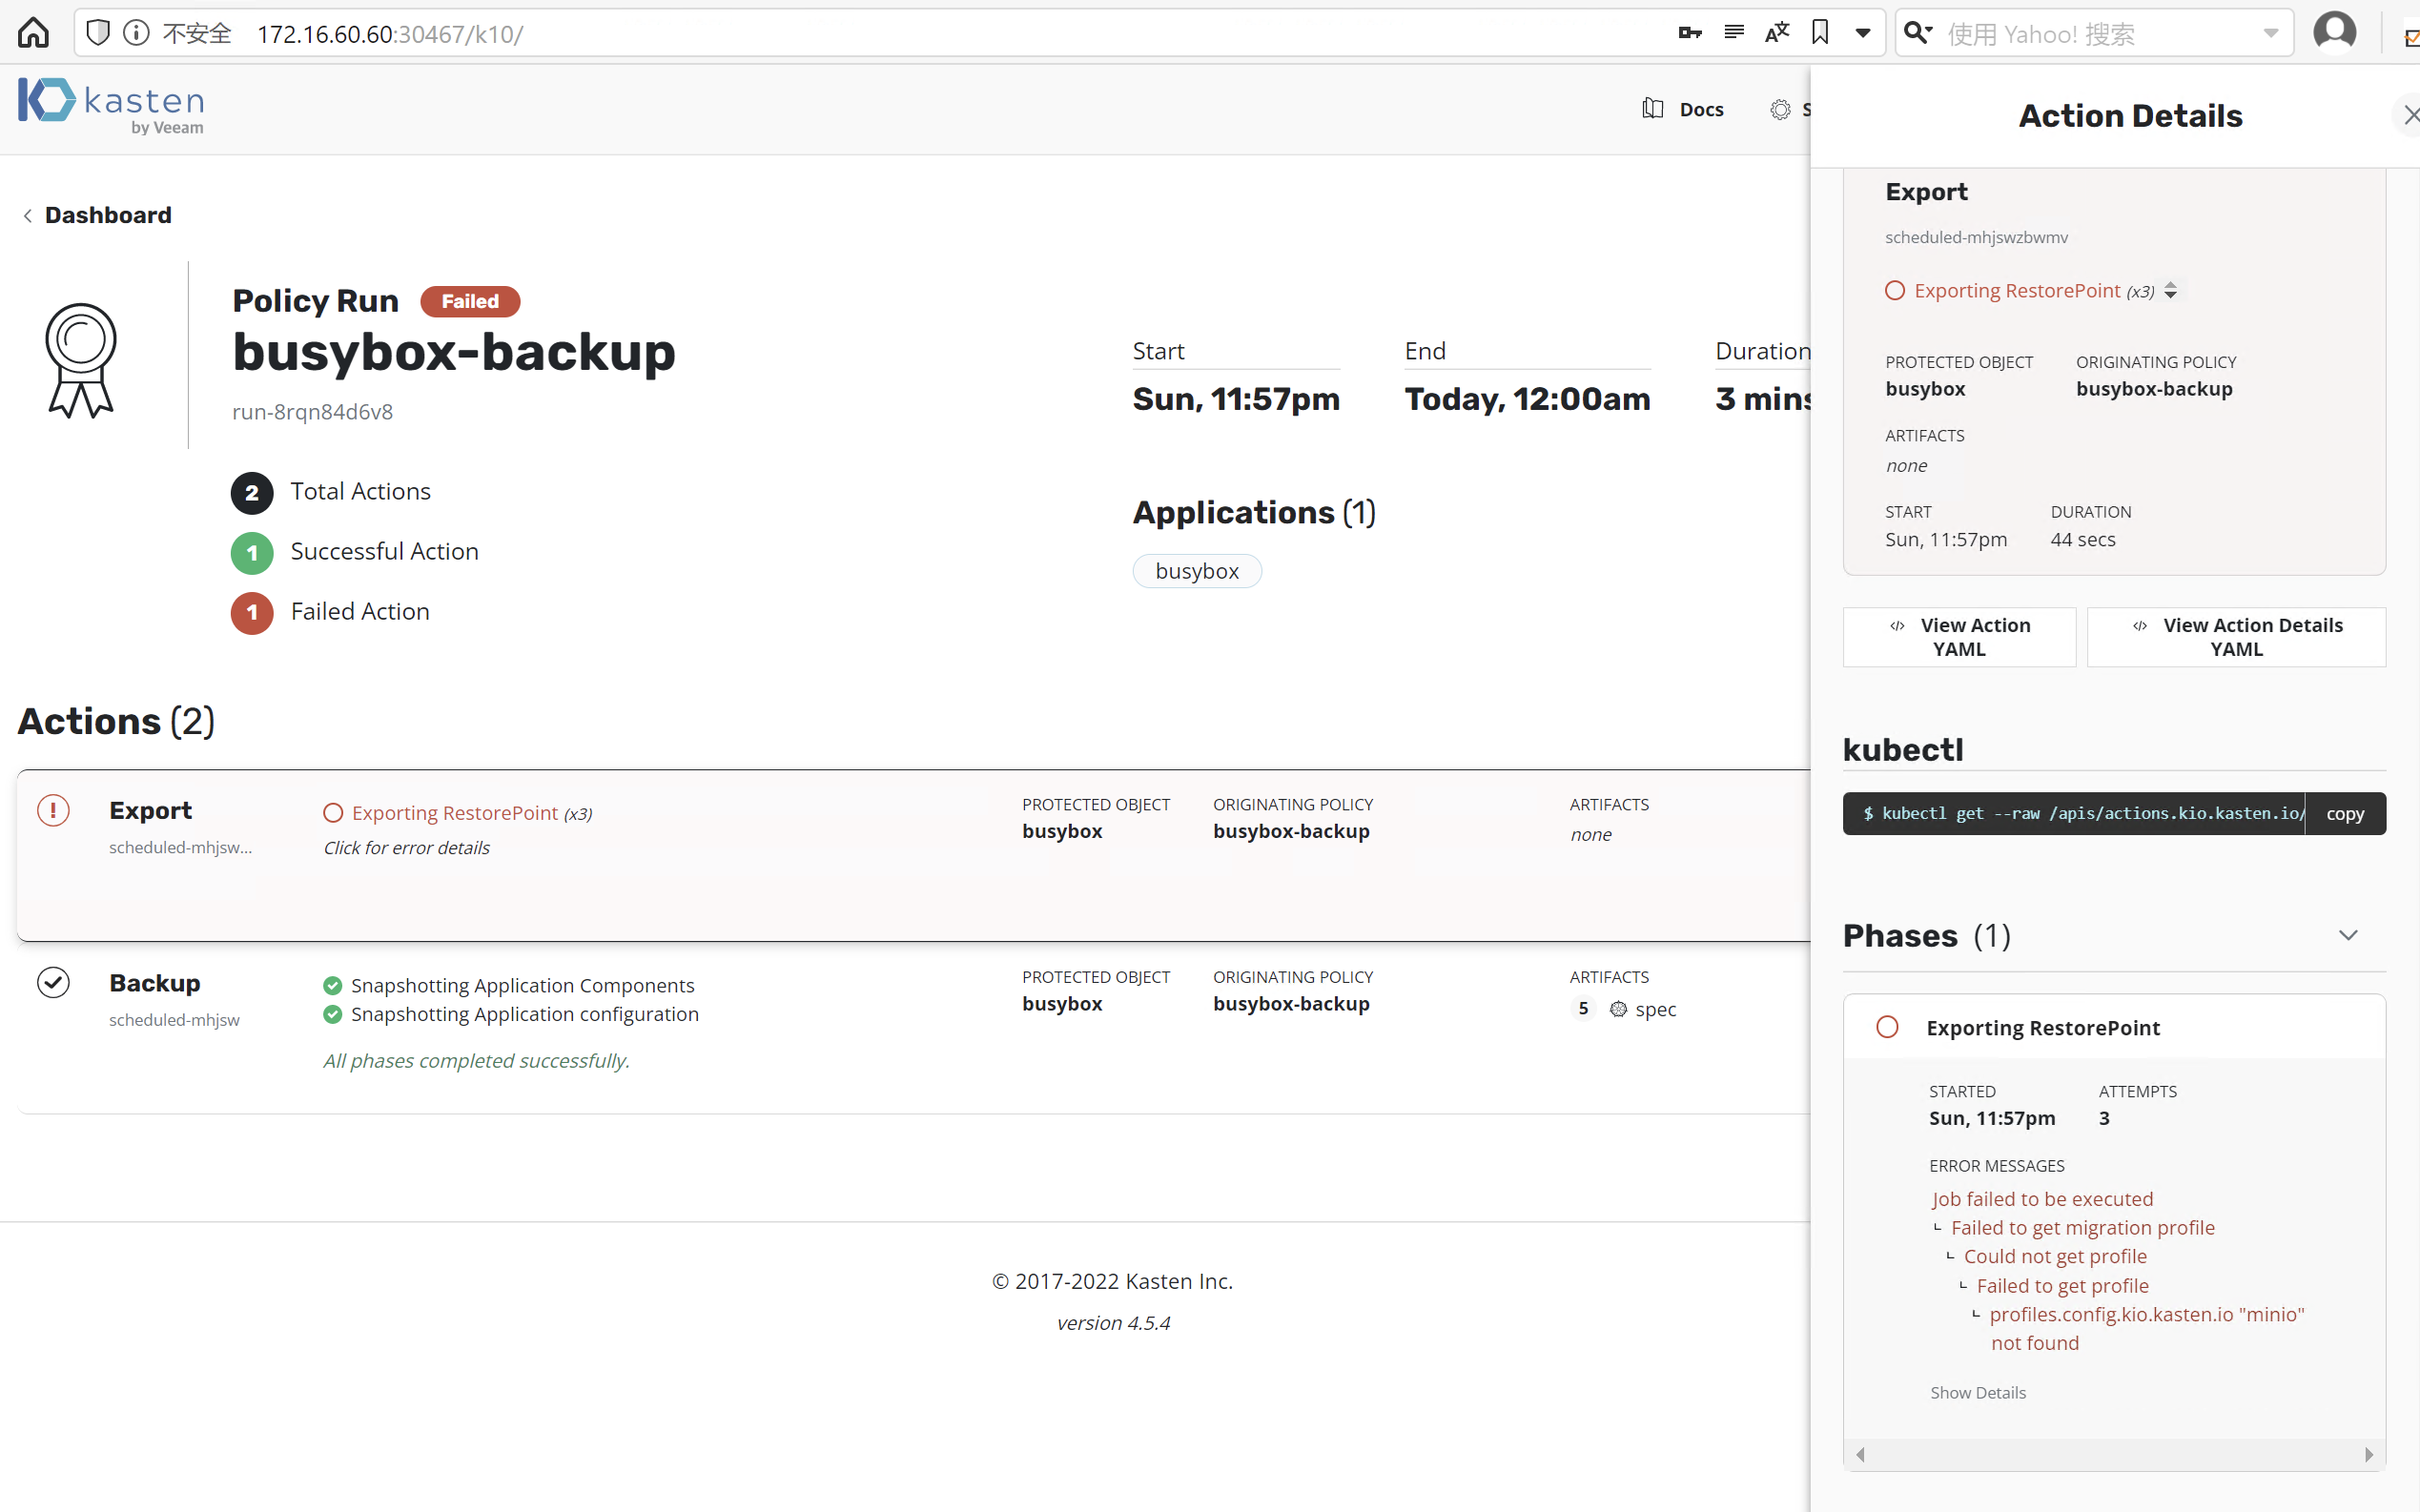
我们在这里制造一个错误,如下图备份策略 busybox-backup 已经指向 minio 存储库,而我们在这里删除它以制造错误。
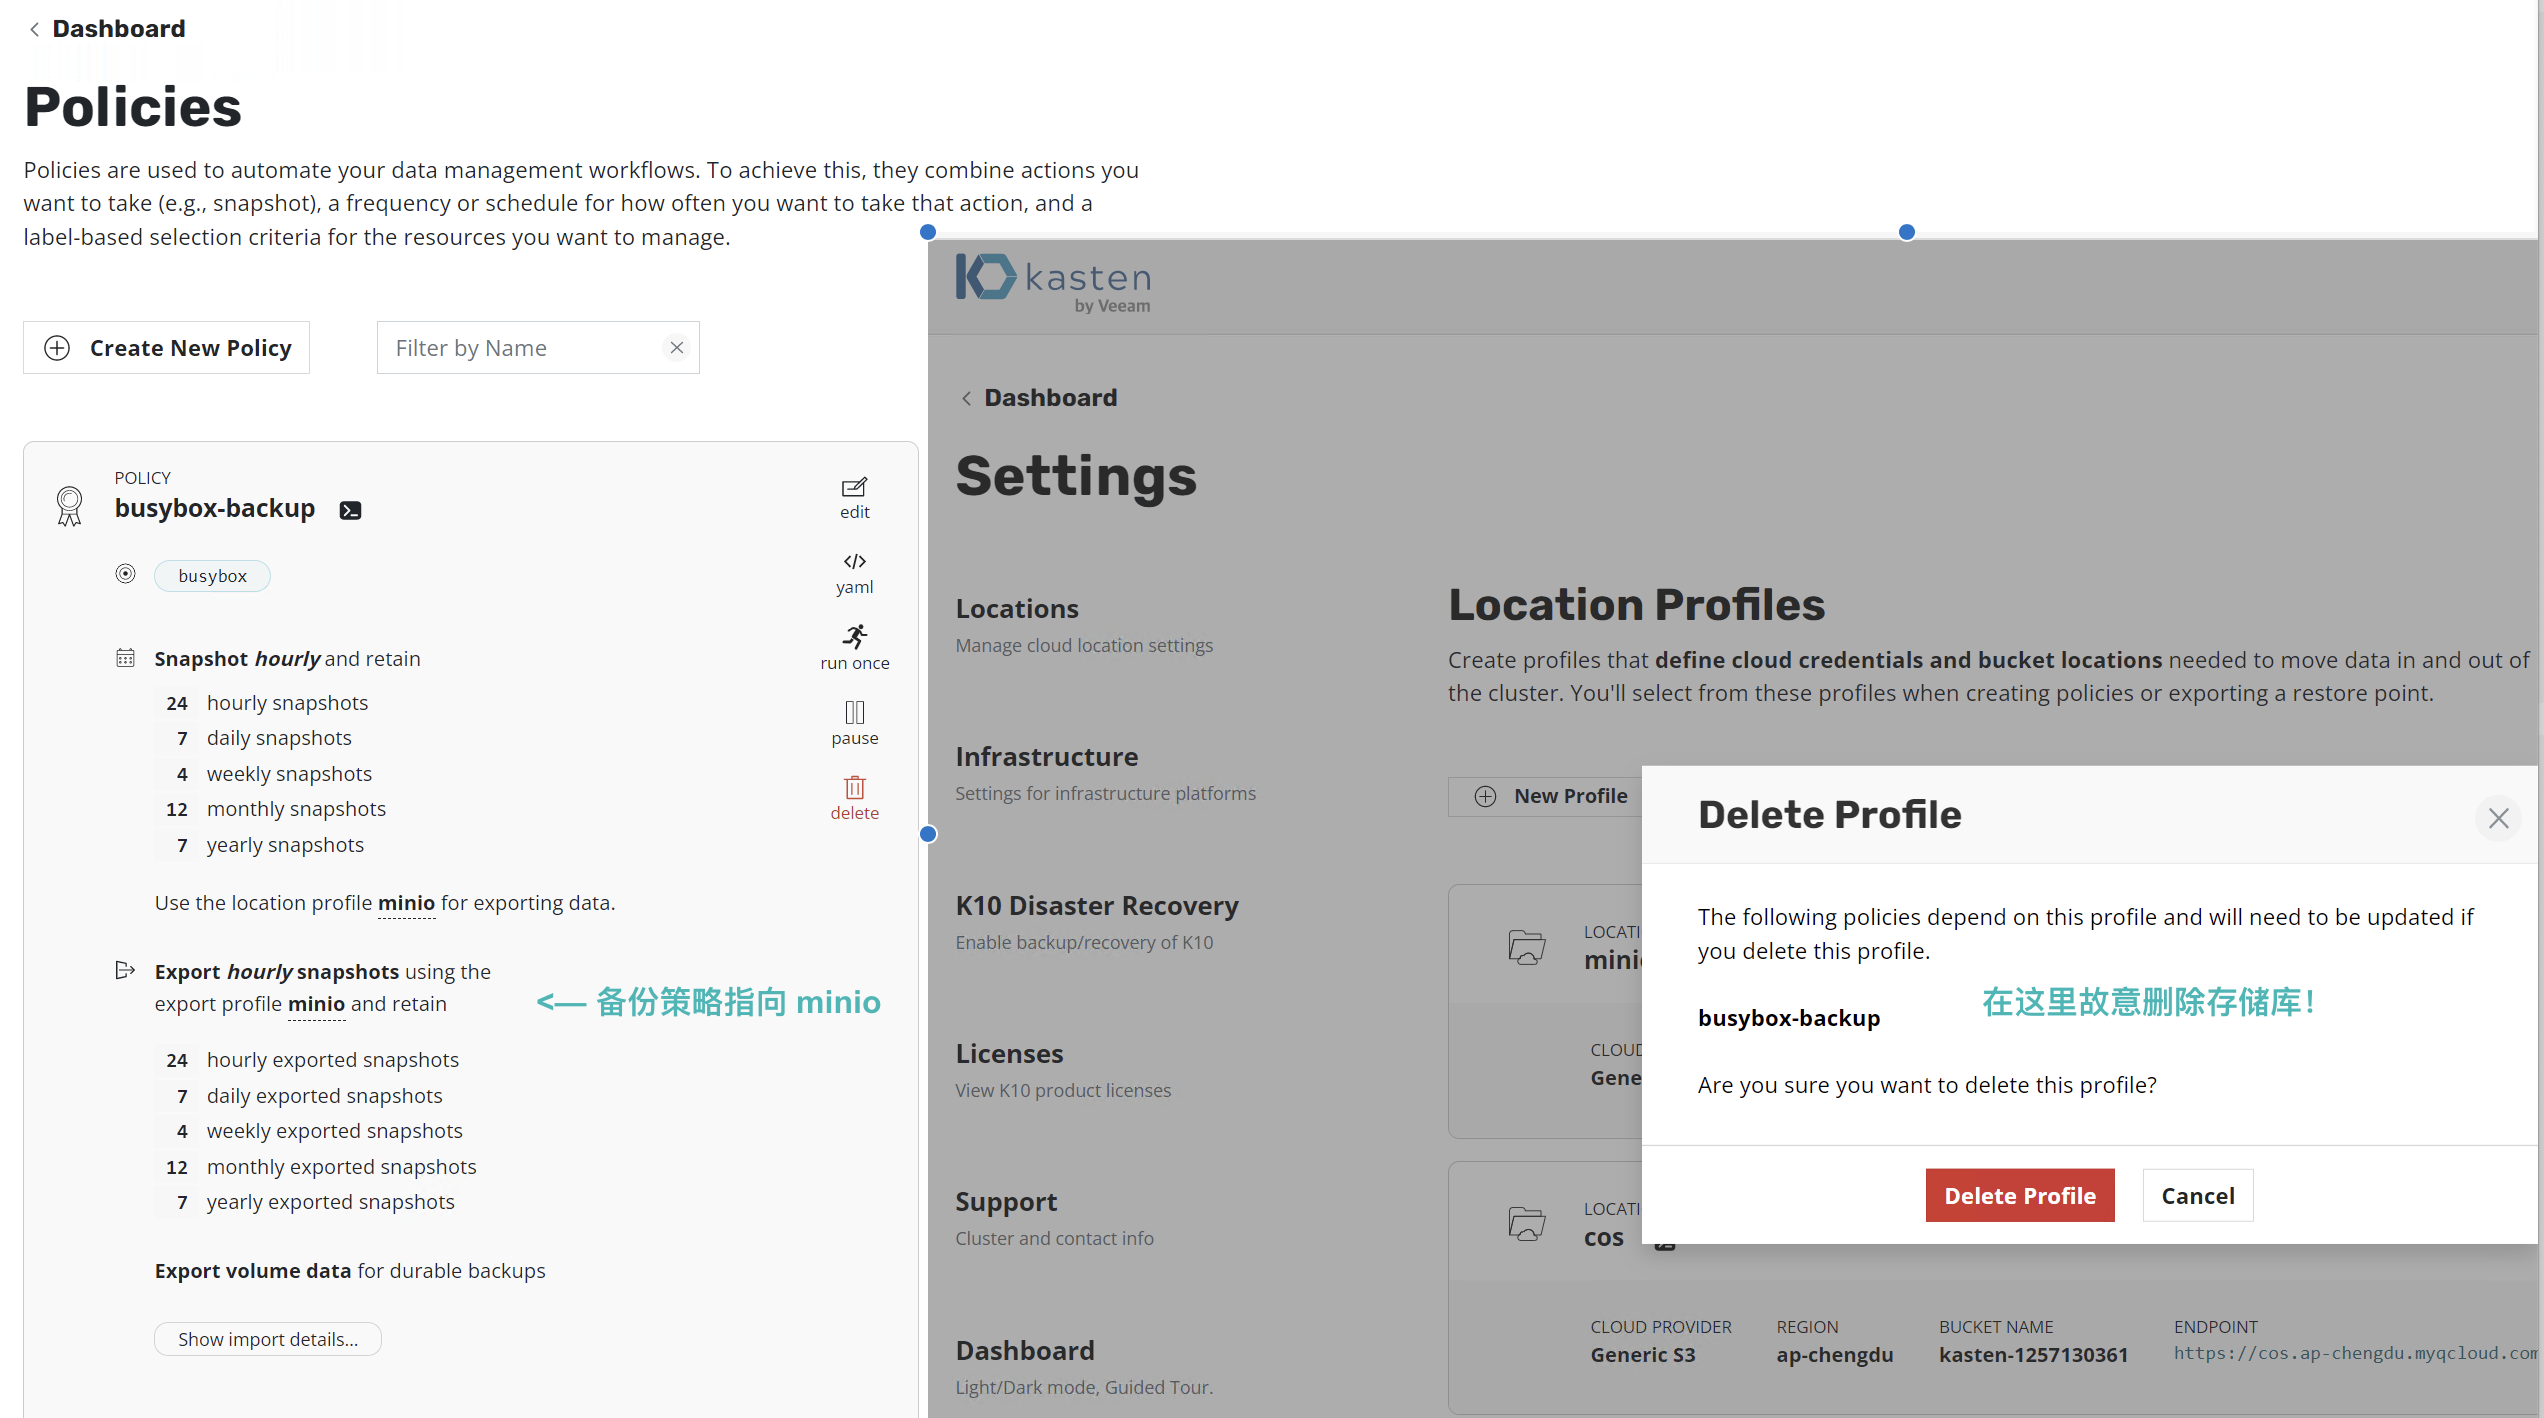
在执行策略时, Kasten 将报错
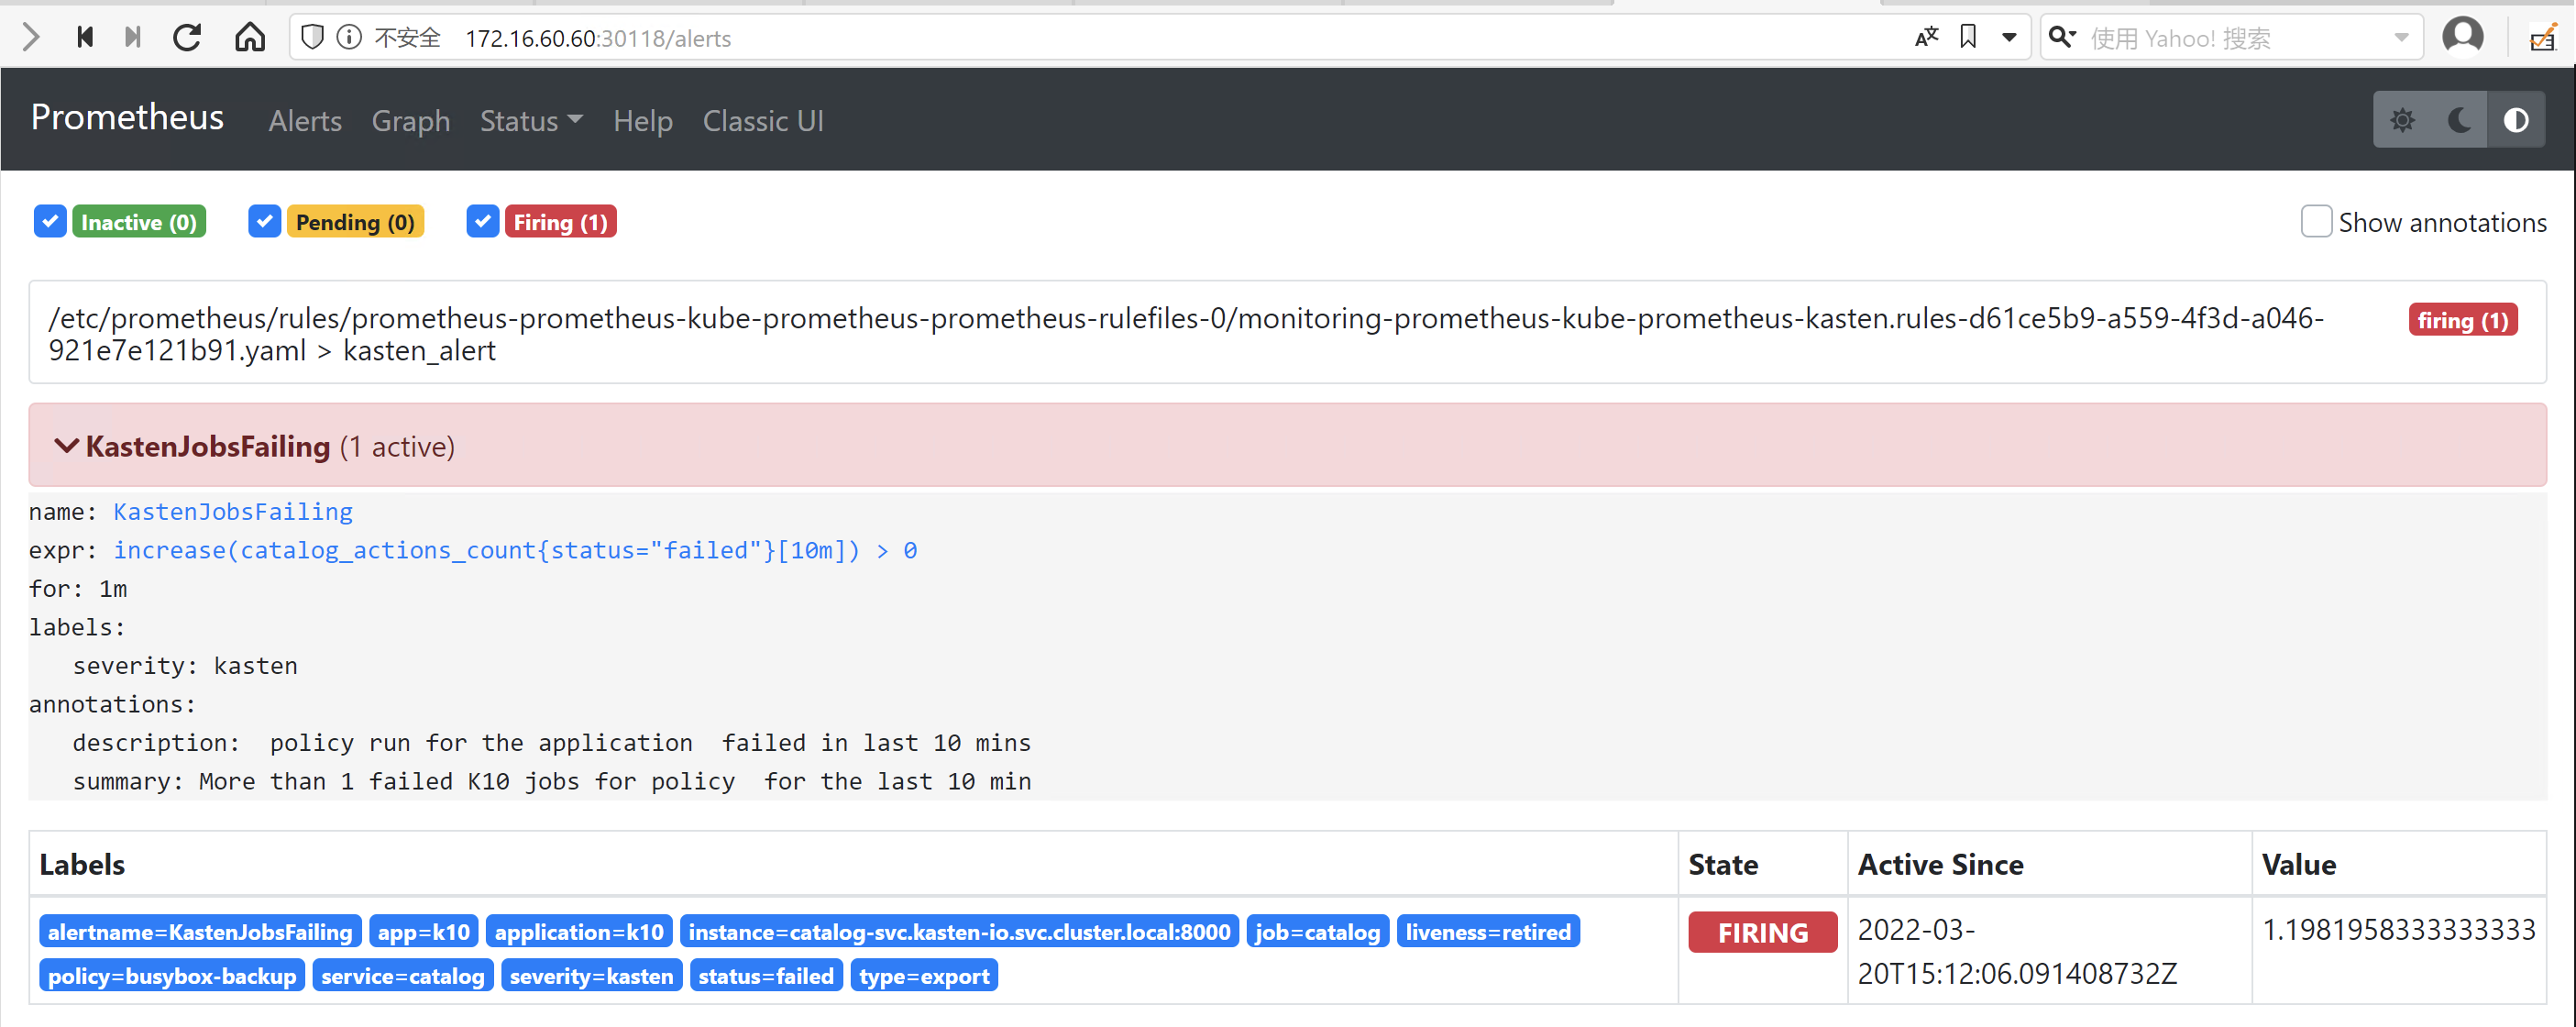
5.2 检查 Prometheus Alert Manager
当然我们在 Prometheus Alert Manager 中也要看到报错,在这里我们将 Prometheus 服务端口直接暴露出来
$ kubectl expose svc prometheus-kube-prometheus-prometheus -n monitoring --type=NodePort --name=prometheus-nodeport
service/prometheus-nodeport exposed

$ kubectl get svc -n monitoring
NAME                                      TYPE        CLUSTER-IP      EXTERNAL-IP   PORT(S)          AGE
prometheus-kube-prometheus-alertmanager   ClusterIP   10.96.193.54    <none>        9093/TCP         22m
prometheus-kube-prometheus-operator       ClusterIP   10.108.21.139   <none>        443/TCP          22m
prometheus-kube-prometheus-prometheus     ClusterIP   10.99.119.208   <none>        9090/TCP         22m
prometheus-nodeport                       NodePort    10.106.211.98   <none>        9090:30118/TCP   4s
prometheus-operated                       ClusterIP   None            <none>        9090/TCP         22m
prometheus-prometheus-node-exporter       ClusterIP   10.107.125.51   <none>        9100/TCP         22m
这时访问 http://Node-IP:Port/alerts 在 prometheus Alert Manager 已经看到报警了
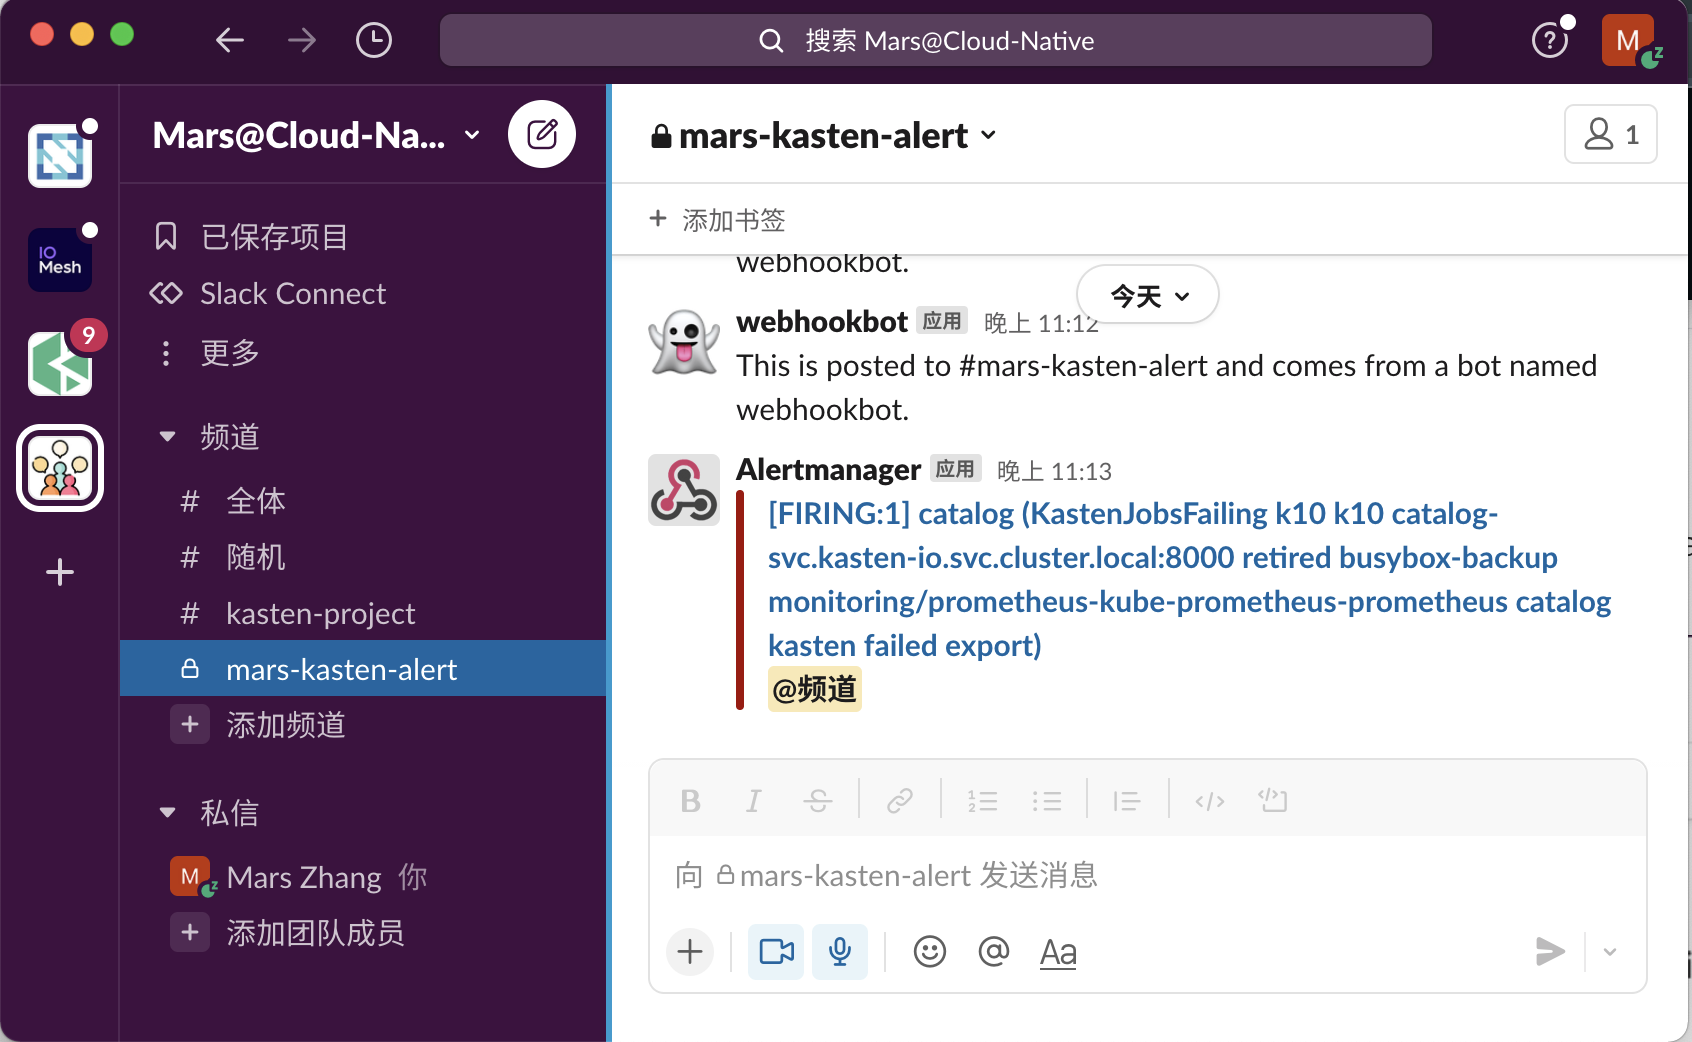
5.3 检查 Slack 中的报警信息
不久之后,您应该会在 Slack 中收到通知,表示配置工作正常
6. 结论
企业的备份系统是与时俱进的,备份策略的创建与执行将是一个不断迭代的过程。对于一套设计良备份策略,出现异常的可能性会比较低,但这并不意味着不会出现异常,有些异常甚至会引起严重的后果,所以如何及时的发现备份策略运行的异常并处理它便显得十分重要了。现在,您已经知道如何在 Slack 中接收警报,这样便可安心的将备份作为日常策略的在后台运行,并确保您的数据和应用程序始终受到保护。
7. 参考资料
关于 Slack
https://slack.com/intl/zh-cn/about
Slack 频道是什么?
https://slack.com/intl/zh-cn/help/articles/360017938993-%E9%A2%91%E9%81%93%E6%98%AF%E4%BB%80%E4%B9%88%EF%BC%9F
Prometheus Aler Manager 配置
https://prometheus.io/docs/alerting/latest/configuration/
Monitoring and Alerts
https://docs.kasten.io/4.0.5/operating/monitoring.html
How to Set Up Alerts in Kasten K10 to Immediately Catch Failed Backups
https://blog.kasten.io/posts/how-to-set-up-alerts-in-kasten-k10-to-immediately-catch-failed-backups
8. 欢迎关注云端数据管理
欢迎关注云端数据管理微信公众号